June 8, 2022
How cloud-based technology is revolutionizing in-line inspections

In-Line Inspections (ILIs) are an essential function for any pipeline operator, providing an understanding into what is happening inside of a pipeline. However, modern ILIs can produce a tremendous amount of data, which can be difficult to organize, interpret, and integrate into operational decision making. That’s why Cenozon developed InSight, an integrated application for managing ILI data.
Nigel Smith is Cenozon’s Senior Integrity Advisor, with over 23 years with experience in project management of inline inspections internationally, ILI analysis, software development, integrity team management and consulting.
“It has been identified that there are significant inefficiencies in reviewing historical ILI data impacting the decision-making process,” said Smith.
“The amount of time and resources spent reviewing each ILI report can be significantly greater than the time taken to make decisions after the review. Quality control issues can be overlooked leading to potential mistakes in data interpretation.”
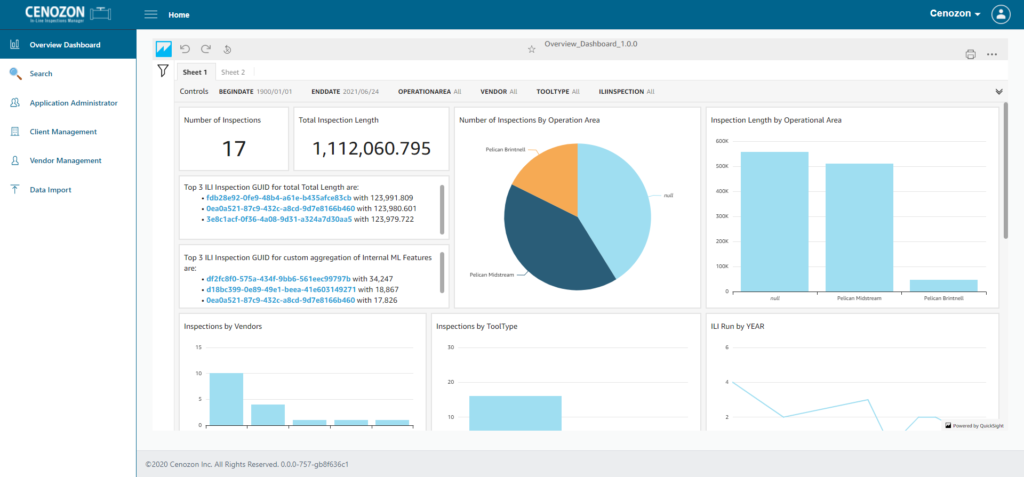
InSight builds on top of Cenozon’s ILI Manager, and functions as a dedicated application and provides a central repository for all inspection data. The inspection data is then associated with geographic data-points and plotted on an interactive GIS mapping interface. This allows operators to visualize their entire pipeline network, and associate inspection data with external geographic factors, such as elevation or water bodies. These dashboards and map will provide an interactive overview of ILI data.

The application will also perform quality control checks on incoming data, allowing greater data reliability and increased confidence in data integrity and quality. This is an important factor when it comes to operational decision making. InSight is providing pipeline operators and integrity engineers the tools to automatically process and assess inline inspection data in a consistent comprehensive format.
“This is achieved by making the manual tasks automated and hence effortless saving time and cost while improving efficiency. The presentation of the data on a dashboard enables visualization of the data (both past and present) in a standardized fashion, to predict future trends, compare information from different runs, and create graphs.”
Some of the more advanced features include:
- Automated multirun feature matching for pipeline joint correlation and pit to pit comparison
- Sentencing of defects to prioritize mitigation plans and prepare dig sheets
- Advanced analytical tools including calculated defect assessment to provide growth rates and determine reliability timelines
- Analyze feature interaction, cluster analysis, defect trends, and correlation of repaired defects to compare NDE depth measurements to ILI reporteddepths
“It will help to increase the ability of an organization to make decisions faster and with a higher level of confidence,” said Smith.
“I am excited to be a part of the team developing a solution that will impact the future reliability of pipelines and make the job of managing pipeline integrity data easier and more cost effective.”
